If your pfSense does not have the performance or has huge storage of handling a network probe such as ntopng package, you can send your logs to an external system. With the use of NetFlow you can do this with softflowd package.
First install softflowd via System>Package Manager, once installed you need to edit the settings for softflowd in the ‘Services’ tab.

Here you must enable softflowd, then state all the interface you wish to monitor. Host will be the I.P that is hosting the docker. NetFlow port ‘2055’, Sampling is down to your needs, NetFlow version ‘9’, Flow Tracking Level to ‘Full’ to log everything.

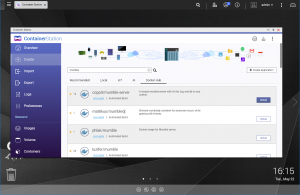
On your QNAP you must create the docker using the ‘Create Application’, this uses the Docker Compose editor to create the docker instance without using a GUI.

Give the application a name, and then copy this YAML configuration for Elasticsearch.
This will use robcowart/elastiflow-logstash-oss docker, you can checkout the docker here https://hub.docker.com/r/robcowart/elastiflow-logstash-oss
version: '3'

services:
  elastiflow-elasticsearch-oss:
    image: docker.elastic.co/elasticsearch/elasticsearch-oss:7.5.0
    container_name: elastiflow-elasticsearch-oss
    restart: 'no'
    ulimits:
      memlock:
        soft: -1
        hard: -1
    network_mode: host
    volumes:
      - elastiflow_es:/usr/share/elasticsearch/data
    environment:
      # JVM Heap size
      #   - this should be at least 2GB for simple testing, receiving only a few flows per second.
      #   - for production environments upto 31GB is recommended.
      ES_JAVA_OPTS: '-Xms2g -Xmx2g'

      cluster.name: elastiflow
      bootstrap.memory_lock: 'true'

      network.host: 0.0.0.0
      http.port: 9200
      discovery.type: 'single-node'
      indices.query.bool.max_clause_count: 8192
      search.max_buckets: 100000

      action.destructive_requires_name: 'true'
  elastiflow-kibana-oss:
    image: docker.elastic.co/kibana/kibana-oss:7.5.0
    container_name: elastiflow-kibana-oss
    restart: 'no'
    depends_on:
      - elastiflow-elasticsearch-oss
    network_mode: host
    environment:
      SERVER_HOST: 0.0.0.0
      SERVER_PORT: 5601

      ELASTICSEARCH_HOSTS: "http://127.0.0.1:9200"

      KIBANA_DEFAULTAPPID: "dashboard/653cf1e0-2fd2-11e7-99ed-49759aed30f5"

      LOGGING_QUIET: 'true'

  elastiflow-logstash-oss:
    image: robcowart/elastiflow-logstash-oss:3.5.3
    container_name: elastiflow-logstash-oss
    restart: 'no'
    depends_on:
      - elastiflow-elasticsearch-oss
    network_mode: host
    environment:
      # JVM Heap size - this MUST be at least 3GB (4GB preferred)
      LS_JAVA_OPTS: '-Xms4g -Xmx4g'

      # ElastiFlow global configuration
      ELASTIFLOW_DEFAULT_APPID_SRCTYPE: "__UNKNOWN"
      # Name resolution option
      ELASTIFLOW_RESOLVE_IP2HOST: "false"
      ELASTIFLOW_NAMESERVER: "127.0.0.1"

      ELASTIFLOW_NETFLOW_IPV4_PORT: 2055
      ELASTIFLOW_SFLOW_IPV4_PORT: 6343
      ELASTIFLOW_IPFIX_TCP_IPV4_PORT: 4739
volumes:
    elastiflow_es:

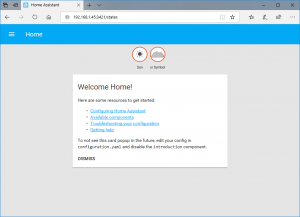
You can access Kibana that will visualise the Elasticsearch data, by accessing it via http://[I.P Address]:5601. It will initially show nothing and it need to import a ready made dashboard to become useful.

To import the dashboard you need to go to Management>’Saved Objects’ and click on ‘Import’

You must download this ndjson file from https://github.com/robcowart/elastiflow/blob/master/kibana/elastiflow.kibana.7.5.x.ndjson
Right click ‘Download’ button and ‘Save Link As’, make sure it does not save as .txt file format. Select the elestiflow.kibana.7.5.x.ndjson file to import.

Once import is successful, we need to make a index pattern for the dashboard to retrieve the Netflow. Goto Management>’Index Patterns’ and click on ‘Create Index Pattern’.

Just put a wildcard ‘*’ to tell it to use all.

Select ‘@timestamp’ as the time.

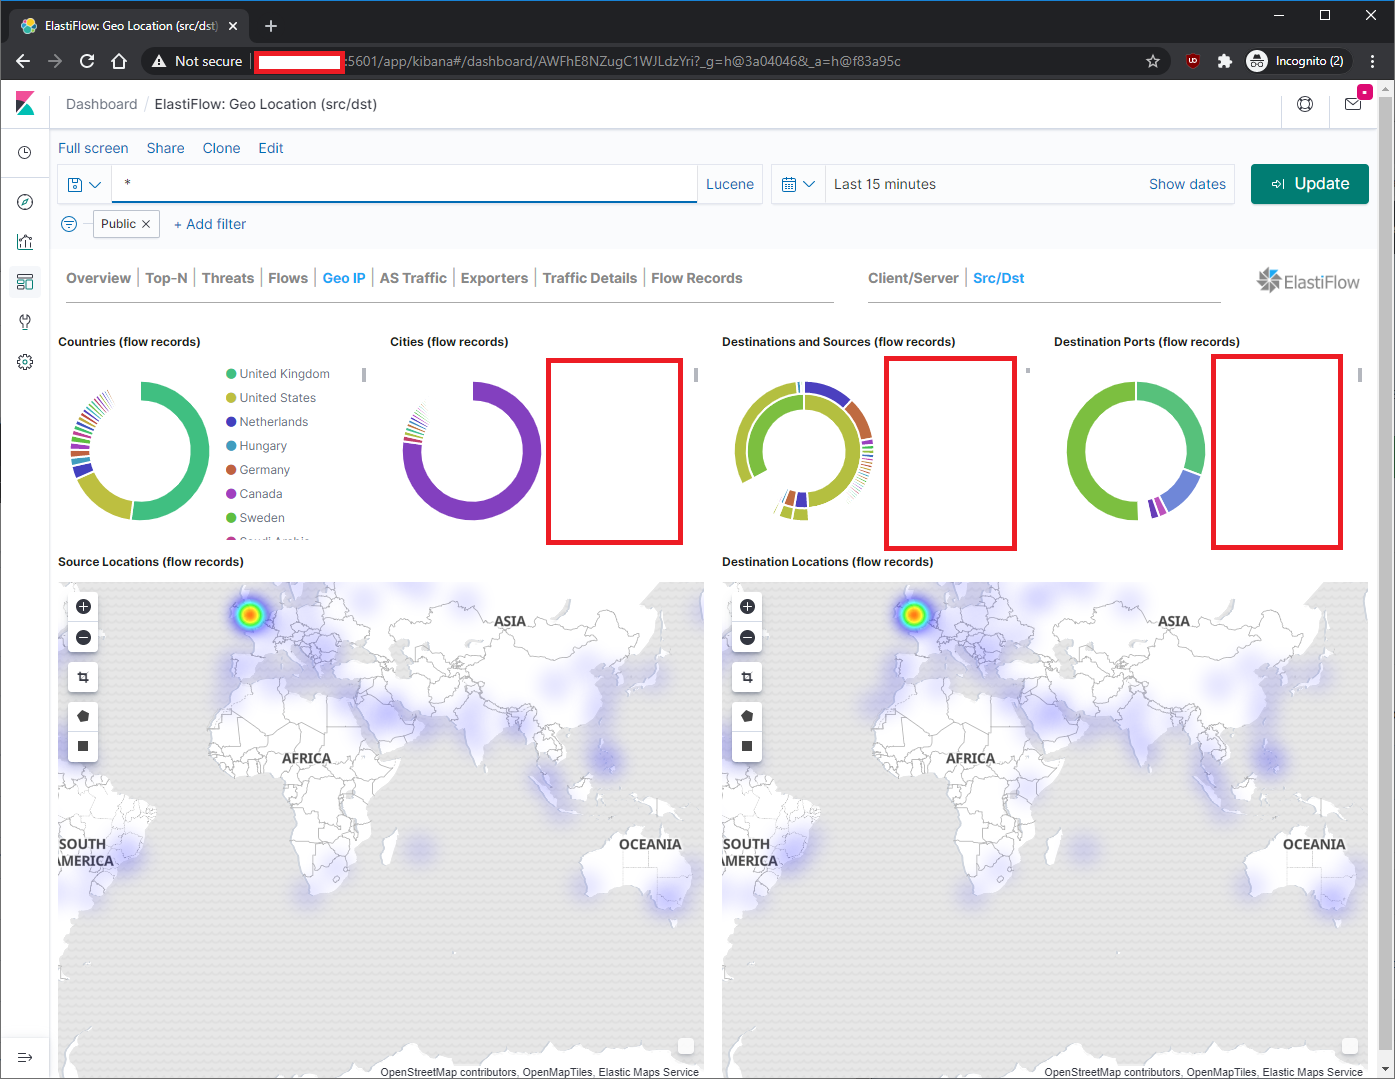
With the imported ‘Dashboard’ you can see a list of pre made dashboards for NetFlow

There is tons of data, because of this the storage requirement is huge. Here is Geo Location:

Here is Flows for Client to Server:

This help lessen the work load for pfSense machine itself, and it could be useful for your use case.
Hi, I’m following this and my elasticsearch container won’t start up on the QNAP NAS: it says “cannot access /usr/share/elasticsearch/data/nodes”. The elastiflow README says I need to create the data folder outside the container, but I’m not sure how or where to do that? Is it the ‘volumes’ bit of container station?
I found it: I had to create a folder on the NAS (I used share/docker) then change the following line (13) to use it:
volumes:
– /var/lib/elastiflow_es:/share/docker/elasticsearch/data
Hi Paul, glad you figured out an alternative. You can amend the volume location to your needs.
The default location is:
Container/container-station-data/lib/docker/volumes/elastiflow_es
volumes:
– elastiflow_es:/usr/share/elasticsearch/data
The external folder is first and then the internal folder. Sometimes there are issue where the docker will have permission issues, is what you probably experience.
Thanks for checking out the guide.